By Tuesday morning the sentiment for the equity ETF's had changed from weakness to at least basing and by Wednesday it was up, finishing the week strongly. Gold, oil and the dollar however, behaved as expected. Lets look at the details:
Gold Daily

Gold Weekly

Gold established a flagging pattern this week. As suggested the 1185 weekly support was tested and held, but it could not retake and hold above the 1211 resistance or the 50SMA on the daily at 1216. A flag after the large drop would suggest a continuation lower to test the 100SMA at 1171 or the 1164 tops from early this year, but the hammer on the weekly suggests a reversal, if confirmed. If the 1185 level is breached on a close then it will go lower, otherwise expect a range with 1216 remaining resistance, with a break above confirming the reversal.
Oil Daily

Oil Weekly

Oil broke above a tight range this week when it pierced through the 50SMA Friday. The daily picture now confirms a new range between 76 and 82, but with the 100 and 200SMAs in between to dampen moves. the weekly picture printed a piercing candle, also giving credence to a higher range. Resistance on the weekly is clustered at the tight $2.50 range between the 20/50/200 week SMAs at 76.-78.68. This tells me if it gets to the top of the range it may get strong support at 79.
US Dollar Index Daily

US Dollar Index Weekly

The US Dollar Index resumed its fall and looks to continue next week as it is establishing another bear flag on the daily. The weekly chart shows a continued move lower. Both time frames point to support at the 83.30 area, the 100day SMA and the 20wk SMA. If it breaks below there is support at 82.25 on both charts. Resistance above is now at the 84.50-85 area.
VIX Daily

VIX Weekly

The VIX is setting up for a stall or reversal at the 200SMA where it has a history of support/resistance lately as seen by the 4 recent bounces there. The weekly view supports this thesis. If support is not held then the weekly chart shows the downtrend line around 18 as next support and is confirmed in the daily. The 28 area has been a node of resistance/support and will act that way on a bounce off of the 200SMA higher.
SPY 60 Min

SPY Daily

SPY Weekly

I put the 60 minute chart up to show just how congested the history has been between 106.84 and 110.76. There will be a lot of chop in this range. Moving to the daily chart, the long term down trend line from September 2007 highs comes into play at 108.80. Add to that the weekly printed an inside candle and resistance above at 108.51. I take from this that a move above 108.80 will chop until can get through 110.40, but if rejects at 108.80 the support should be at the 104.38-.75 area.
IWM Daily

IWM Weekly
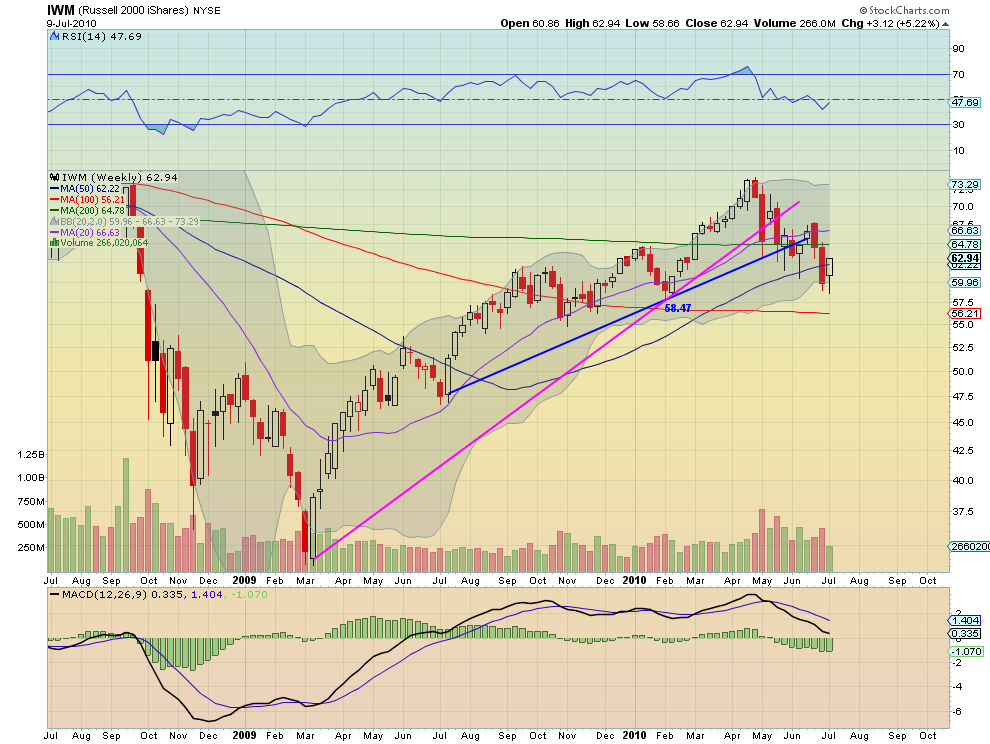
The daily chart shows resistance at the 200SMA very near and above that 65.57 form the 50SMA. Support comes from the 61.50 box bottom and then 58.40 below. Moving to the weekly, the inside candle straddling the 50wk SMA also shows support around the 58.80 area and resistance at 64.78 200wk SMA. looks like a range this week to me with a bias to setting a lower high from the falling 50day SMA.
QQQQ Daily

QQQQ Weekly

The daily chart shows a new rising trend forming but overhead resistance near where the 50 and 200 SMA are due to cross soon near 45.40. The weekly shows 45.70 as resistance. Volume on this run up has been divergent as it is falling. The daily chart sees support at 43.50 from May-June and then 42 - 42.50, with the weekly seconding that with support at 42.78 from February and 42.28, the 200wk SMA. Note that the weekly printed an inside candle on this chart as well, leading me to look for a range week up coming.
That is it for the broad market. Looks most likely a range bound week for equities with a bias to the top of the range. I will post some individual names this weekend and Top 10 Ideas Sunday. Have a great weekend!


No comments:
Post a Comment