Saturday, July 31, 2010

Top 10 Ideas for the Week of August 2, 2010

After looking at over 500 charts and posting my thoughts on over 200 of them I have found some good setups for the week. This week's mix is identical to last week's with 8 long setups, two short ideas and one potential break out. These were selected in and should be viewed in the context of the broad market trend reviewed Friday which looks stronger for gold and oil. The US Dollar Index seems to be headed to the woodshed for a further beating and US Treasury Bonds may drift to the top of their range. Less volatility in the volatility index and a weaker dollar should make it easier for stocks to rise from what looks like a minor bias to the upside for IWM to a bullish indication for SPY. Here are the top ten, tonight in no particular order:

1. Endo Pharmaceuticals Holdings, Ticker: ENDP


If it gets above the triangle at 24.85 then there is some resistance at 26 but a target of 32. Support lower on a rejection of the triangle bound is massive, as all 4 SMA 20/50/100/200 and the triangle triangle bottom.

2. RINO International Corp, Ticker: RINO


Could not get above the 15.50 top from June and now it is looking for support at the 50SMA 13.13. This is the potential entry point. If it holds it should re-challenge the 15.50 top, with 12 below as support.

3. Caribou Coffee Co., Ticker: CBOU


Flagging above the recent 10.52 resistance. Now it is ready to pop to 11.50 resistance then 12.90 both from near the issuance 5years ago. Support is at 9.73 below and then the 10.52 area.

4. Crocs, Ticker: CROX


Broke the 12.28 resistance level so ready for higher. The RSI says it is getting overbought as it is above 70 but it can stay overbought for sometime and there is no resistance until 15.49. Support below is at 12.28 then 11.30.

5. Anadarko Petroleum Corp, Ticker: APC


It reclaimed and is holding a range between 49.08, the Resistance/Support line, and the 50.52 area. Could break either way. Above 50.52 the first resistance is at 55 and then 56.68. A break below 49.08 sees support at 44.95. Nearly 10% either way. August 49/50 split straddles went out at 4.26, anticipating this move will happen. Better return in the stock.

6. American International Group, Ticker: AIG


It is holding the break above the descending triangle well. There is resistance 40 then 42.5 above. Then the real money kicks in. Support lower is at 36.06.

7. Jefferies Group, Ticker: JEF


There is a flag forming after the recent move higher, ranging between the 100 and 200SMA, 24.16 and 24.81. Looks like it will break higher. The target on a break is 27.50. There is support below at 24 then 22.79.

8. Emulex Corp, Ticker: ELX


8.70 has been a big area of support in the past and it is testing it now. On a break lower the first support is at 7.75 followed by 7.26. Resistance is at 9.90 if it bounces.

9. NCR Corp, Ticker: NCR


It rejected 14.35 last week and is now looking for support at 13.42. If it finds it there and holds resistance is at 14.35 for a 7% win.

10. Research in Motion, Ticker: RIMM


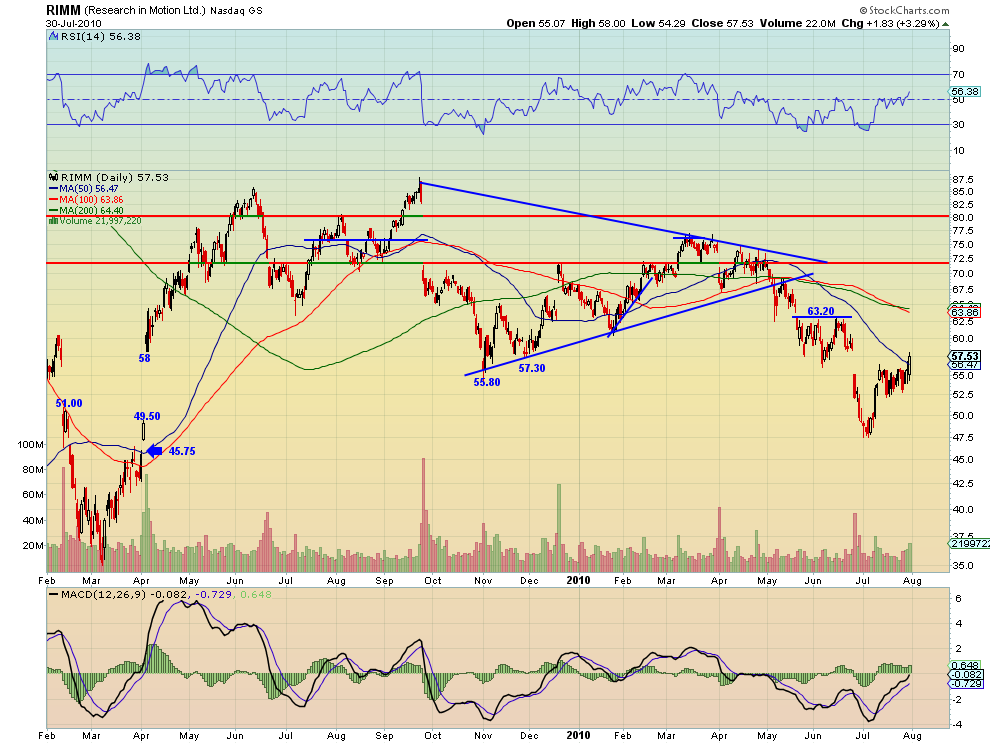
It broke above the 50SMA Friday and finished at resistance near 57.5 and filled the gap down from late June. it is ready for a move higher now to the 63.20-63.86 resistance area. Support below is at the 50SMA at 55.25.

Bonus Idea: National Bank of Greece, Ticker: NBG


Come on, all of the European banks are okay and the National Bank of Greece is rising. You have to be kidding me. This at the top of a Dead Cat Bounce at the 100SMA. RSI is falling and the MACD is rolling over. Target is 2.50 or the 50 SMA whichever is lower.

No Top 10 List next week as I will be taking a short vacation. Back the following week. Trade'm well!

Friday, July 30, 2010

From the Charts: Macro Week in Review/Preview 7/30/2010

We entered the week with Gold looking weaker and oil looking stronger. The dollar index seemed to be in limbo and equity Index ETF's seem to be poised to move higher with support of a VIX looking to move lower. Gold and Equity index ETF's moved as expected Monday and early Tuesday but then reversed course. Oil declared itself to be range bound and the dollar broke lower later in the week, taking bond yields lower. I am adding a new indicator this week, the iShares Barclays 20+ Yr Treasury Bond Fund, Ticker: TLT, as a proxy for the bond market. Let's look at the details:

Gold Daily

Gold Weekly


Gold had fallen out of the upward channel on the weekly chart last week and lost the supp of the 20wk SMA at 1190 on Monday. This allowed it to fall to the 1162-1164 support area from April. After a bounce it is attempting to retake the 100SMA and the 20WK SMA with a hammer on the weekly. The monthly chart however is adding to the resist at 1180. Above that another run at 1213 and higher can take place.

West Texas Intermediate Crude Daily

West Texas Intermediate Crude Weekly


Oil has been in a range between 76 and 82 for several weeks now, the game has been to figure out if it will be above or below the 100SMA in that range. It took a short trip above and has been hovering around the 100/200 SMA area. The weekly chart shows just how tightly bound that range is in the broader context. I am not expecting any change from this in the coming week.

US Dollar Index Daily

US Dollar Index Weekly

US Dollar Index Monthly


The US Dollar Index has been in a down trend since the beginning of June. Despite what looked like a pause in the daily chart this week the weekly shows continued downside which appeared in the daily later in the week. 80 - 80.70 looks to be a support area. I have added the monthly chart here to show just how ugly it could get below80 with support at 77.50 then 75, both corroborated on the weekly and daily charts.

iShares Barclays 20+ Yr Treasury Bond Fund Daily

iShares Barclays 20+ Yr Treasury Bond Fund Weekly


Treasury Bond yields have been a recent lows lately with prices near all time high levels and have been ranging lately. This is easily seen in the weekly chart with the range being 98-102 on the TLT. I expect this range to continue next week.

VIX Daily

VIX Weekly


The daily chart of VIX shows a continued elevated level and reduced range with 23.50 acting as support. The weekly shows more clearly that there is a descending triangle formed and it is near its conclusion. There is support below around 22 on a breakdown and 26 appears to be resistance above. Expect it to remain elevated in the coming week.

SPY Monthly

SPY Weekly

SPY Daily


Today was a big day as there were many reasons (price levels) to be fearful coming in. Going backward on the SPY the monthly chart shows a clear reversal of the downtrend with a bullish engulfing candle and above the 108.09 Fibonacci level. The weekly shows a doji but very close to last weeks high and above the 50 week SMA and finally the daily tested and held the 109.15 support area from the monthly chart today. It avoided virtually every potential pitfall today and looks to go higher now. 112 to 112.5 is resistance.

IWM Daily

IWM Weekly

IWM Monthly


The Russell 2000 ETF daily chart shows a bottom was found at the 50/200 day SMA cross near 63.79. From a touch there Friday it rallied to resistance at 65. The weekly looks a bit less bullish with a doji just above the 200week SMA at 65, but could be just resting. Moving to the monthly chart, IWM shows an inside candle and a range of 58.07 to 65. If it can hold above 65 then it will act as support for a run to 66.70 then 67.50 and 70. Failure sees support at 63.79 then 63 before 60. Based on SPY I expect it will hold and move higher.

QQQQ Daily

QQQQ Weekly

QQQQ Monthly


Finally the Q's look very similar to the IWM. The daily shows it bounced off support of the 200 SMA and stalled at the 45.75 resistance area. The weekly shows a doji right at a resistance/support line, but the monthly is slightly more bullish as it closed above the previous month's real body. Less indecision here, a short term positive next week with 46.70 as resistance.

So next week looks to bring stronger prices for Gold and Oil. The US Dollar Index seems to be headed to the woodshed for a further beating and US Treasury Bonds may drift to the top of their range. Less volatility in the volatility index and a weaker dollar should make it easier for stocks to rise from what looks like a minor bias to the upside for IWM to a bullish indication for SPY. Good luck next week!

Thursday, July 29, 2010

Levels to be Fearful: The Prequel SPY

110.41, 109.15, 108.09, 107.84 and 107.01

Tomorrow is month end for the market and so there are many different views of the market that will be coming together, each painting a picture of the past and trying to glean an insight into the future. Using the S&P 500 SPDR's, ticker: SPY as a proxy for the market and a tool to guide us through the process, let's take a closer look at what could scare and how likely it is to happen.

SPY Monthly Chart


The monthly chart shows 3 levels that if the SPY closes below them could cause some downside panic. The first is 108.09. This is a 50% retracement of the movement from the October 2003 lows to the October 2008 highs. The second is 107.84. Below this level SPY would no longer print a bullish engulfing candle as it looks today, (where the body of this candle totally engulfs the preceding candle and closes higher - this is a bullish signal). Last, the 107.01 level where it would give up the 100 month SMA.

SPY Weekly Chart


On the weekly chart there are two additional levels that could be party poopers. The first is 110.41. This would create both a lower close than the high of the previous week and a shooting star pattern that is bearish. The second is 109.15, the 50 week SMA.

Are these levels 110.41, 109.15, 108.09, 107.84 and 107.01 even possible? Lets look at the daily and hourly charts for clues.

SPY Daily Chart


The daily chart printed a bearish engulfing candle today signaling a bearish trend to come already. Also below the 110 area that it is near and tested today the next level of support is the area where the 20 and 50 SMA's are converging at 107.98-108.21. This makes the first 3 of the 5 levels possible.

SPY Hourly Chart


The hourly chart shows a convergence of the 50 hour SMA and the down trend line at 109.19. Below that the 200 hour SMA at 107.95 provides further support. You can also see several other support and resistance areas along the way and lower. This chart also confirms the possibility of the first 3 levels and show what it would take for the last 2 to occur.

First, let me state that I am not predicting doom and gloom, only showing that there are downside scenarios to protect against, as illustrated from the technical analysis of the charts. These are real possibilities, though and you should be prepared for what you will do if they occur.

Good luck tomorrow!

Sunday, July 25, 2010

Top 10 Ideas for the Week of July 26, 2010

After looking at over 500 charts and posting my thoughts on over 200 of them I have found some good setups for the week. Another week another change in view. Last week there were 8 short set ups two potential break outs and one long idea. This week nearly opposite with 8 long setup two short ideas and one potential break out. These were selected and should be viewed in the context of the macro view which looks weak for gold and positive for oil. the dollar is in limbo. Equity markets seem poised to push higher and a falling VIX is supporting this. Here are the top ten, tonight in no particular order:

1. Netflix, Ticker: NFLX


This stock is heading down to 98.32, the 100SMA. Inside continuation day Friday. Resistance is at 110 then 113.24.

2. Pactiv Corp, Ticker: PTV


Shooting star or spinning top after a consolidation. Might be the start of a break higher but I am looking for a quick retest of the channel and the 50SMA. Will use 31 as a stop.

3. Under Armour, Ticker: UA


Confirmed the break out of the symmetrical triangle. The target on the move is 42. Support below stands at 36.50.

4. Whirlpool, Ticker: WHR


Printed a Morning Star reversal candle Friday right on the 200SMA. Should rise from here with a target of 90 target then 95.28. There is support below the current 85.97 level at 84.

5. ReneSola Ltd, Ticker: SOL


Piercing the 7.90 resistance level again. If it gets above 8.25 get in for a ride up. The potential is 11.5-12, and there is support at 7.25 and then 6.37.

6. Origin Agritech Ltd, Ticker: SEED


Same juicy story here as last week. If it can get above the 50SMA (acting as a descending triangle) it can run to 9 then 10.5. Support below is at 6.81 before a gap down to 5.80.

7. BP Amoco PLC, Ticker: BP


I am sure this will be a controversial pick, but it broke, tested and held the 50SMA. It is heading to 39.75, the next resistance with 42, and 45.74 above that. Support below at 34 if the market decides it was not Hayward's problem.

8. Jazz Pharmaceuticals, Inc, Ticker: JAZZ


Printed a long string of tight candles the past two weeks. It has bee consolidating between 8.25-8.98. My bet is it breaks higher, above 8.98, and then resistance is at 9.61.

9. Visa, Ticker: V


Defied the recent Head & Shoulders top and marched higher to the 75.75 Fibonacci level. It looks to get above it and then it will see resistance at 82.26-82.68, the 100/200 cross area. If it fails support is at 70.11 for a two headed monster.

10. Ctrip.com Inc, Ticker: CTRP


Strong move back to the 40.75 level on Friday. If it gets through then next resistance is at 44 then 46 above. Support on a pullback is at 38.71.

Bonus Idea: InfoLogix Inc,Ticker: IFLG


This stock is gathering lots of energy. Now which way will it pop? If higher look for 8, then 10 then 13 as resist. If lower 3.50 is support below. I am betting higher, but watching. My friend @tlento on twitter reminds us that there is a big dilution coming up in August.

Trade'm well!

Friday, July 23, 2010

From the Charts: Macro Week in Review/Preview 7-24-2010

Coming into this week there looked to be further weakness in equities and gold ahead. Oil appeared to be heading higher. The dollar index was showing signs of a bounce but had room to move lower if support did not hold. Monday held true to the research but the equity markets quickly reversed Tuesday morning and started moving higher. Oil did continue to press higher and Gold lower with the dollar index continuing to waffle. Finally the VIX remained in a tight range. Let look at the details:


Gold Daily

Gold Weekly
Gold set out creating a lower bear flag on Monday and just sat there, flipping from 1195 support to being resistance. The weekly chart shows that this is bearish going forward as it fell out of the upward channel, but is still holding support of the 20wk SMA, barely. Look for a test of 1179 from the daily range. If that fails 1143 is the next support and then 1116 from the weekly chart. If 1179-1183 holds then a retest of resistance at 1207 could happen.


West Texas Intermediate Crude Daily

West Texas Intermediate Crude Weekly
After holding the new higher range 76-82 oil kept plugging away at the 100 day SMA breaking through it and the 200 SMA on Thursday. Friday confirmed the break above the 200 SMA and a move into the top of the range. It now has a chance to run higher to 82. The tightly bound SMA's on the weekly chart will act as support, with resistance above 82 at 87.


US Dollar Index Daily

US Dollar Index Weekly
The dollar index held the 82 support level on Monday but probed it 3 days this week. Wednesday's strong push higher was beaten back and more on Thursday. The weekly chart shows a long run down to support at 82.25. The weekly suggests that it will go lower as the MACD is just getting started and the RSI indicates it is not oversold. Watch for support at 81.42 if it fails here. The 83.52 area is resistance if it bounces.

VIX Daily

VIX Weekly
The Volatility Index appears to be bouncing like a superball (each bounce has a lower high) off of the 23.50 area creating a descending triangle pattern. Note that the 23.50 level represents that volatility has been elevated since the beginning of May. From a technical analysis perspective the VIX appears to be headed lower. If that happens it would create an atmosphere where price gains in stocks would be easier to achieve. Keep that in mind.


SPY 60 minute

SPY Daily

SPY Weekly
SPY is trying to change the trend from down to up. The 60 minute SPY chart shows that there is a lot of congestion between the 110.41 close and 112 with several instances of resistance and support in between. The daily chart confirms a break of the downtrend lines and a near touch of the 200 day SMA at 110.68 which could give resistance. The weekly chart shows a move higher with resistance at 112.21 the 20wk SMA. SPY is in a transition phase. If it continues up to 112 the trend will have changed top rising and look to 113.2, the June highs, as resistance. If it gets knocked back 108.40 looks to be support.


IWM Daily

IWM Weekly
Strongest of the Index ETF's. The IWM saw a strong move higher to resistance at 65 over the last 4 days, through the 200day and 50 day SMA's. It now sits just above the 200wk SMA at 64.73 and looks to be heading for 66.50-.71 as resistance from both the daily and weekly charts and support below at 62.23-.52. Small caps leading higher.


QQQQ Daily

QQQQ Weekly
The Q's are the weakest of the Index ETF's. The daily chart shows that the rally ended just at the downtrend line from early May. The weekly shows that it broke the 45.90 resistance level but is in a resistance range now topped at 46.60. This resistance is confirmed on the daily chart near 46.70. If it rejects this resistance are the support area below is 45.13-.30 first and then 44.45. Given the outlook on the VIX and the other Indexes the bias would be for a break higher.

SO we enter next week with Gold looking weaker and oil looking stronger. The dollar index seems to be in limbo and equity Index ETF's seem to be poised to move higher with support of a VIX looking to move lower. Individual names will come over the course of the weekend and Top 10 Ideas Sunday. Have a great weekend!