Gold Daily

Gold Weekly

Gold had a good run up this week and printed an inside day today near the 1255 resistance level after testing lower and regaining the 1245 support level. It probed the 1255 level 3 times this week without losing ground and looks to head higher and test the 1265 are above it. Support at 1245 has held but there is additional support at 1233 should it pullback. The channel in the weekly chart gives a resistance level above 1265 at 1328 and shows support at 1225 then 1180.
West Texas Intermediate Crude Daily

West Texas Intermediate Crude Weekly

West Texas Intermediate Crude futures also had an inside day and finished near resistance of 74.80-75.1. If it does not reach higher that than Monday's open near 75.50 then it will continue with a lower high building a symmetrical triangle. Above 75.50 it can run higher and sees resistance at 76 and then the cluster of Simple Moving Averages (SMA's) higher between 76.56 and 77.82. There is support on the way down at the 72 area and then 70.50. The weekly chart shows a bullish hammer for the second consecutive week, a bullish indicator if confirmed by a higher week next week. Yet all those weekly SMA's between 75.21-77.75 will act as resistance as well. Should oil get through all those SMA's there is room to 80 and higher. The weekly chart also shows additional support points at 71.19 and 67.72.
US Dollar Index Daily

US Dollar Index Weekly

The US Dollar Index took a beating this week falling out of its bullish flag and looks headed lower. It ended on support at 82, with 81.50 and the 80.70-81 area as support below. If 82 holds and it bounces there is resistance at 82.50 and then the 83.25-.50 area above. On the weekly chart the Dollar Index lost support at 82.25 with the next support 81.64followed by 80.46.
iShares Barclays 20+ Yr Treasury Bond Fund Daily

iShares Barclays 20+ Yr Treasury Bond Fund Weekly

After an inside day Monday my proxy for US Treasuries, TLT, printed an bearish hanging man on Tuesday and if there was any doubt confirmed it Wednesday, Thursday and Friday. Having lost the 105 area of support, it looks weak and headed to fill the gap lower to 102ish and then maybe the lower support levels of 100 and 98. Despite being lower today there is a chance for a bounce, heightened by the hollow red candle (bullish in a bearish kind of way) today. Resistance would come first at the 105 area, then 106 and 108. The weekly chart adds to the bear case printing a Bear engulfing candle, covering the last two candles.
VIX Daily
VIX Weekly

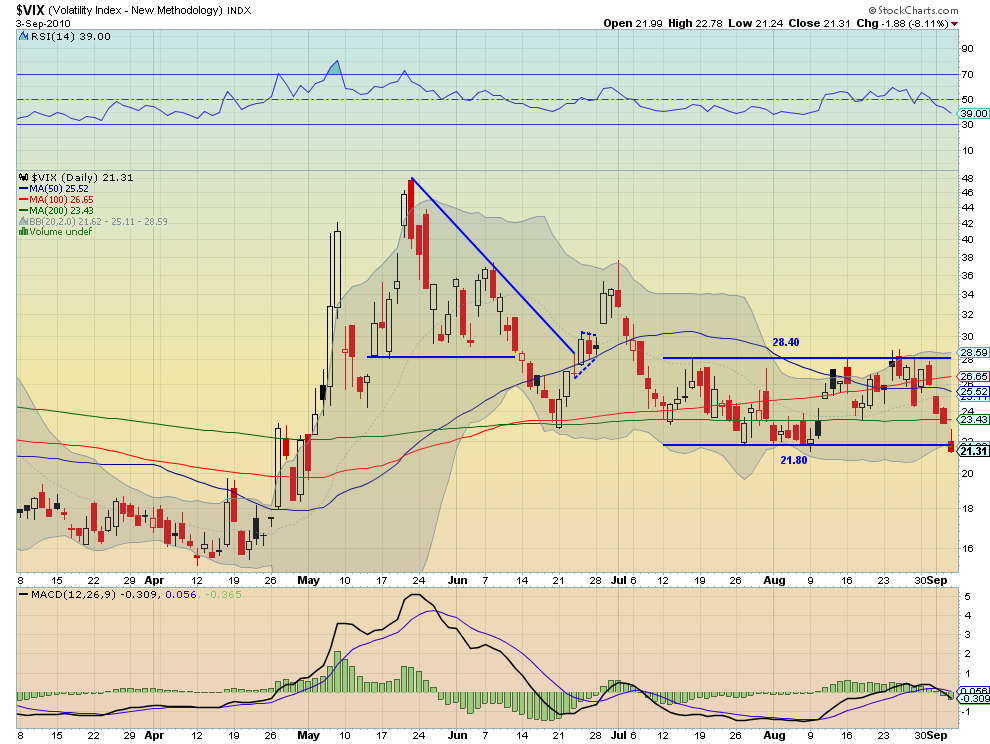
The Volatility Index ran to the bottom of the channel it has been in for the last 2 months, barely breaching it today. The lower bound of the channel 21.80 is now resistance with 23.47 and 25.52 resistance above that. There is support at 18 then 15.80 lower if it cannot hold the channel with a fingertip. The weekly chart shows support at 21.25 with 16.93 below that. Holding above 21.25 on the weekly it could see resistance at 24 then 26 and 28. Watch 21.25 as below that would add to the bull case for stocks.
SPY 60 minute

SPY Daily

SPY Weekly
 The 60 minute chart for the SPY shows it breaking above a lot of the clutter between the 106 and 110.50 range. it looks good for more. Now there are only a few resistance points higher around the 112.13 area before it tests 113.20 and some clear air. On the daily chart it printed a Hanging Man today a possible bearish omen, right on top of the 100 day SMA (support) and just below the 200 day SMA (resistance). There is support lower at 109.40 and then 108.48 before the strong support at 107.10. The weekly chart shows the rally started off of support at the 104.35 area and rose through the cross of the 20wk and 50wk SMA's. It also adds resistance higher at 114.67.
IWM Daily

IWM Weekly
 IWM also had a great bull run but ended the week with a Hanging Man on support of the 200 day SMA, a possible bearish indicator. There is support lower at 63.35 and then 62.77 and 61.87 below. It looks to rise however and test resistance at 65.24 and then maybe 66.50. The weekly chart shows a big bullish candle stopping right at the cross of the 20 week and 200week SMA's near 64.50. This all happens within a flag so the certainty of a further rise is suspect. There is resistance higher at 65 and then 67.50. It also shows additional support at 60.5 and then 58.68.
QQQQ Daily

QQQQ Weekly

The bull move in the QQQQ is the strongest of the equity index ETF's. There is no Hanging Man creating uncertainty, but rather a Three Advancing White Soldiers pattern that is very bullish. It stopped it s run today near resistance of the 100 day SMA. There is resistance higher at 46.25 followed by the 47 area. Support on a pullback comes first at the 200 day SMA and then the 45.00 to 45.25 area. The weekly chart adds to the bull case printing a Bullish engulfing candle that drove through both the 20 week and the 50 week SMA's which will now act as support. the weekly adds resistance higher at 48, and support points lower at 44 followed by 42.46.
So next week looks to bring stronger prices for Gold again. The US Dollar Index and US Treasury Bonds look to continue their moves lower. Oil is set up for a move higher but does not have much room before it runs into a wall of resistance. And falling volatility index combined will create the environment for stocks to push higher. Enjoy your Labor Day Weekend and Good luck next week!


No comments:
Post a Comment