Showing posts with label Technical Analysis. Show all posts

Friday, September 24, 2010

Rising Three Methods - In Real Life

There are lots of great names for Japanese Candlestick patterns, 3 White Advancing Soldiers, Marubozu, Hanging Man, Hammer and my favorite Dragonfly Doji. We have seen a lot of them lately but this week presented a very bullish pattern that we have not seen in a while in the indexes, Rising Three Methods. This is a 5 candle bullish continuation pattern. The first candle is a long white (or green) candle. The next 3 are descending red candles that are contained within the first white candle. The final candle is another long white candle that closes above the first candle.

The Rising Three Methods is about to be confirmed today in the December e-Mini Futures. This chart is as of about 2:00pm Friday. Technically the shadows on the down days should not go outside of the range of the first white candle, but it is most important that the lower shadows do not breach. That is the case here.


If the Futures close above 1136.50 today the pattern will complete and will be a very bullish signal. Right now it looks likely. Watch 1136.50.

From the Charts: Macro Week in Review/Preview September 24, 2010

This week began looking to bring more new highs for Gold with US Treasury Bonds and the US Dollar Index set up to move lower. Oil looked like it may join them going lower as well. The relatively low volatility index looked like it would not impede stocks from moving higher but only the QQQQ's seemed ready to move with the SPY and IWM still scratching their heads about the next move. I detailed this in the broad market trend reviewed Friday September 17th. As the trading began Gold and the Dollar Index behaved as telegraphed from the charts with Oil stagnating but US Treasuries finding support and reversing higher. The QQQQ's jumped and dragged the SPY and IWM with them. Stocks then took a breather for 3 days and jumped again on Friday, very similar to a bullish rising three methods pattern, that we saw in the e-mini futures. What is in store for the markets next week? Let's look at the charts.


Gold Daily

Gold Weekly
Gold has been on a tear. Today it tagged 1300 and then pulled back slightly. It could rest here as the Relative Strength Index (RSI) is getting overbought. It still looks good for more upside from the clear uptrend channel on the weekly chart. 1345 looks to be the next resistance from a projection off of that weekly chart. Support can be found at 1270 and then 1255.

West Texas Intermediate Crude Daily

West Texas Intermediate Crude Weekly
West Texas Intermediate Crude has been caught in the tangle of the Simple Moving Averages (SMAs) which are acting as both resistance and support on the daily charts. The flat-lined Moving Average Convergence Divergence (MACD) and RSI right at 50 on both the daily and weekly charts indicate no clear trend, but the weekly chart shows a very slight up trend. When Oil gets clear of the SMA's it should make a nice move, the question now is when and which way.

US Dollar Index Daily

US Dollar Index Weekly
The US Dollar Index is having a horrible run as a result of the Treasury printing presses. This week the wounds reopened and the bleeding picked up. It is now through all major SMA's and looking for support at 79 with the next support lower at 78. Resistance (we can dream can't we?) can be found now at 79.50 and then 80. The weekly chart shows a very disturbing pick up in the negative MACD indicator this week making matters worse.

iShares Barclays 20+ Yr Treasury Bond Fund Daily

iShares Barclays 20+ Yr Treasury Bond Fund Weekly
US Treasuries, as proxied by TLT, seem to be drifting around. I redraw these lines more frequently than any other chart. It looks to be on support of the uptrend from April at 103.50 from the daily chart. Support below that would come at 102.50 and then lower at 102. Resistance can be found at 104.06 followed by 104.80. The RSI is right at 50 and the MACD can't make up it's mind either as it looks the slower and faster signals look like they are repelling each other as they come close to a cross. The weekly chart looks like it is losing the uptrend, barely, or perhaps filling the gap from 6 weeks ago before a run higher. Blowing in the wind.

VIX Daily

VIX Weekly
The Volatility Index has been in a range between 21.25 and 28.40 for nearly three months and looks to continue that way next week. All of the SMA's are within the range on the daily and most are looking like flat lines now, acting as resistance on the way to the top of the range.

SPY 60 minute

SPY Daily

SPY Weekly
The 60 minute chart on the SPY shows that it is now clear of a lot of the resistance and support areas from the past four months and can look to new higher levels if it can hold up. The daily chart shows a strong up move today that stopped right at the 114.84 area that was some support just after the May 6 flash crash. Above that are there is resistance at 116.50 and below is support at 112.61 and then 109.87. The RSI is pointing higher and the MACD is now increasing again. It looks higher. Switching to the weekly chart, the SPY cleared the 200 week SMA today at 114.69. here is a good uptrend developing and RSI and MACD are supporting further advancement. Resistance shows up at 118.50 and then 120.89 on the weekly.

IWM Daily

IWM Weekly
The daily chart of the IWM shows a strong move up to resistance at 67 today with further resistance at 67.50 and then 70 higher. Support can be found at 66 and lower at 65.50. This also looks to be headed higher with the MACD and RSI supporting the bull case. On the weekly chart IWM broke above the downtrend line now sees similar resistance levels as the daily at 67.60 and then 70. Support can be found on the weekly at 64.66 and then lower at 64.19. IWM is now above all of its major SMA's on both the daily and the weekly charts.

QQQQ Daily

QQQQ Weekly
The QQQQ's have been the beast of the equity indexes lately leading the bull charge, and the Three Advancing White Soldiers (actually four) on the weekly chart bode for more to come. Resistance on the daily chart shows up at 50 and then 50.4 higher. there is support at 49.10 and then 48.3 below. RSI is getting into the overbought range on the daily so it may rest and let the SPY and IWM catch up. But it appears the April highs are in sight very soon. This too is above all of its SMA's on both charts.

So next week looks to bring stronger prices for Gold again and more flogging of the US Dollar Index. US Treasury Bonds seem to change direction with changes in sentiment and Oil looks to be stagnating. The relatively low and stable volatility index combined with that weaker dollar create a fertile environment for stocks to continue higher. Good luck next week!

Thursday, September 23, 2010

Are We the Only One's on the Planet Blind to the True State of Our Market?

The last couple of weeks have shown daily uncertainty in the US market as the SPY is toying with a key resistance level. Many believe it works through and then heads higher. Others see the run up that has occurred and are waiting for a pullback (i.e. not sell off). The prevailing sentiment is the market goes higher. Here is the SPY chart.

SPY


Looks like a rising wedge or maybe an ascending triangle, trying to break out higher. Both are pretty positive short term so why shouldn't the sentiment be positive? Most technical analysts will say that knowing that price action is enough. A few will tell you that it is important look at the inter-market relationships for potential catalysts as well. But it is an even smaller group that will take in the broad market news, economic and monetary policies to gain an edge. When looking at the SPY from that perspective there is a markedly different picture.

Look at the SPY from the perspective of a British investor for example.

SPY priced in Sterling

It has been in a downtrend and is now losing the 100 day Simple Moving Average (SMA) as it crosses down through the 200 day SMA,after breaking the downtrend. But that is just one area of the world, with some issues. What would a Japanese investor think. Here is the SPY priced in Yen.

SPY priced in Yen
For a Japanese investor the SPY is breaking the downtrend but lost support of the 100 day SMA and looks headed lower. Hmmm. Not as positive either. What about others?

SPY priced in Euro
SPY priced in Swiss Francs
SPY priced in Australian Dollars


These are even worse, with clear downtrends. Adding in the rest of the world using Gold as a proxy...

SPY priced in Gold

... and it is a clean sweep. Every place else in the world the SPY looks to be in a downtrend. How can we have one view and the other 5 billion people on the planet another? This is a clear sign that the US stock market is being propped up by the weak dollar and loose fiscal policy. I know you need to trade the market you have and that shows a potential to break higher. But be cognizant that the future is not so bright.

Trade'm well and be careful.

Sunday, September 19, 2010

Top 10 Ideas for the Week of September 20, 2010

After looking at over 500 charts and posting my thoughts on many of them, I have found some good setups for the week. This week's mix contains 5 long ideas with 5 short setups, and one breakout. These were selected in and should be viewed in the context of the 
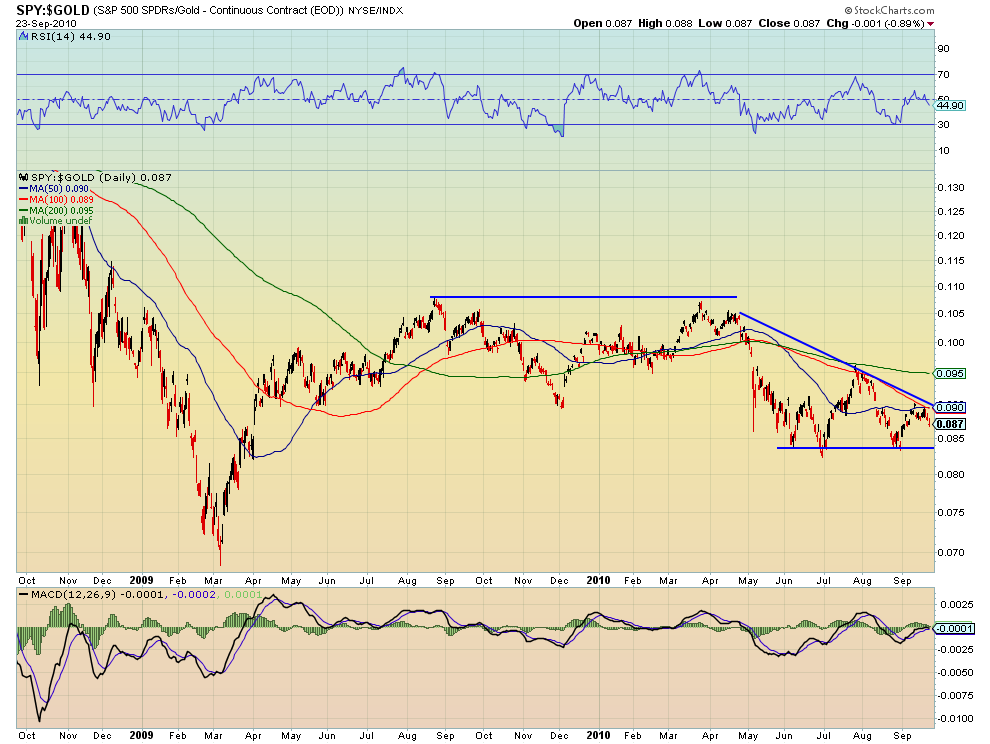
broad market trend, reviewed Friday, which looks bring more new highs for Gold. US Treasury Bonds and the US Dollar Index appear to be heading lower. Oil looks as if it will probably join them going lower as well. The volatility index does not seem like it will impede stocks but only the QQQQ's seem to know that they want higher with the SPY and IWM still scratching their heads about the next move. Sector analysis showed that the strongest sectors were Technology and Consumer Staples and the weakest Utilities, but all were showing signs of sluggishness as was detailed in my review Saturday.

Here are the top ten for the week in no particular order:

1. Blackrock, Ticker: BLK
Blackrock is holding above 162.9, the 50% Fibonacci retracement level of the March 2009 to January 2010 move. If it continues to hold it looks to test resistance at 170, and then 180.98. Support can be found at 156.51 below the Fibonacci level. The Relative Strength Index (RSI) is starting to get Overbought (OB), but the Moving Average Convergence Divergence (MACD) is strong. It looks good higher.

2. Regions Financial, Ticker: RF
After failing at the 7.40 long term resistance/support line Regions has been moving lower. Now that it is through the 200 day Simple Moving Average (SMA) at 6.99, which will act as resistance, it is on the way to 6.35. The MACD is waning and the RSI pointing lower adding to the bear case.

3. SunPower, Ticker: SPWRA
This stock has been in a downward trend for over a year, probably the only solar stock that is. They must put solar panels in the shade or underground. After rejecting the 50 day SMA it is heading to the center of the channel again, and support near 11. Failure there leads to support lower at 10. The 100 day SMA at 12.89 would act as resistance if the 50 day does not hold it down. The RSI is falling and the MACD waning here as well.

4. Callon Petroleum, Ticker: CPE
Callon has been holding support at 3.62 for a month and looks to be poised to rise with the RSI and MACD picking up. It will see resistance at 4.20 and then 4.46 higher.

5. Mellanox Technologies, Ticker: MLNX

Mellanox broke through the recent resistance just above 17 Wednesday and through resistance of the 50 day SMA at 17.57. It retested the 50 SMA and held and is now ready to try higher with resistance at 19 followed by 20.35.

6. Mindspeed Technologies, Ticker: MSPD
Mindspeed rocketed up 14% Friday. So what is it doing on the top ten list, a pullback? No, it still has room to resistance at 9.50, another 9% higher. The strong volume Friday, rising RSI and MACD add to the bull case. Support would be found at 7.90.

7. Lululemon Athletica, Ticker: LULU
Lululemon jumped off of earnings and settled into a bull flag last week. It is slightly OB but this is due to the fast hard move up. If it can get through resistance at 44, it sees some resistance at 45 and 46. Above that the Measured Move (MM), distance from the bottom of the run to the flag added to the top of the flag, would be in the low 50's! Support can be found at 43.

8. Buffalo Wild Wings, Ticker: BWLD
Buffalo Wild Wings ran to the 48.50 long term resistance/support line and rejected. It is headed lower now and should test support at 42.60-.90. The RSI turned violently lower and the MACD crossed adding to the bear case.

9. Biovail, Ticker: BVF
Biovail has had what seems like endless flags and pops higher, but the chart looks tired now. Support can be found at 26.50 and if it breaks that the next support is at 24. Resistance is higher at 27.50. This has been hughely OB and now the RSI is falling and the MACDis decreasing and indicators about to cross. I like it lower.

10. Hi-Tech Pharmacal, Ticker: HITK
It looks like the 3 week run is over for Hi-Tech Pharmacal. It printed a bearish Hanging Man candle Friday near resistance of the 100 day SMA at 21.13. The MACD has been decreasing and the RSI is now leveled out. Support can be found lower at 20 and then 18.89 below.


Bonus Idea: BP Amoco, Ticker: BP
The 50 day and 100 day SMA's are squeezing BP from both sides into a series of thin candles. This could pop either way out of the impending cross. If it breaks higher then resistance can be found at 39.75 followed by 42. If it breaks lower then support comes first at 34 then 33. Perhaps a straddle? I Love it when you get two ways to win!

Have a great week and trade'm well!

Saturday, September 18, 2010

SPDR Sector Review/Preview September 18, 2010

In my review of the SPDR sectors this morning I noticed again that then could be separated into 3 groups based upon their recent price performance. Each chart has some interesting technicals associated with it that I have detailed previously on chart.ly and in my twitter stream so I will not go into those details here. I will focus here on the relative strength of each sector from the recent price history. The first and strongest group contains Technology, XLK and Consumer Staples, XLP. These charts show strong uptrends since bottoming in the beginning of September.

Technology Select Sector SPDR, XLK
Consumer Staples Select Sector SPDR, XLP
The XLK has just completed an bullish Inverse Head and Shoulders pattern but sits near 22.62 resistance from June with resistance at 24 higher and a target from the pattern at 24.75. It also printed a bearish Hanging Man Friday though. The question for XLK in the future is whether the Hanging Man or the Inverse Head and Shoulders is confirmed. The XLP tagged the March-April resistance at 27.80 but stalled there. It has clear air above it if it can get through. Both charts show support areas at the highs in August and below that at their respective Simple Moving Averages (SMA's). Both show that the shorter SMA's the 20 and 50 day are rising, to or through a falling 100 day SMA and a flattening 200 day SMA. This is positive for prices. But both also show and waning Moving Average Convergence Divergence (MACD) and flattening Relative Strength Index (RSI) suggesting the upward moves may be running out of steam. Remember these are the strongest sectors, but have shown their first sign of weakness.

The second group shows a few more signs of sluggishness and contains Health Care, XLV, Consumer Discretionary, XLY, Materials, XLB and Industrials, XLI.

Health Care Select Sector SPDR, XLV
Consumer Discretionary Select Sector SPDR, XLY
Materials Select Sector SPDR, XLB

Industrials Select Sector SPDR, XLI
These sectors are all at or near resistance. But more significantly they are all showing various degrees of flagging at that resistance. XLV is just beginning at the one extreme and XLB and XLI have been flagging for a week or more, at the other end. Three of them nearly printed bearish Hanging Man candles Friday, with long shadows showing signs of selling pressure emerging, with the fourth having a flat out bearish day Friday. They all exhibit a flattening or falling RSI and a MACD that has been declining for several days. The SMA's on the short end are upward sloping, so they may snap out of this flattening. But they are showing signs of waning strength at least.

The third group is the weakest and includes Financials, XLF, Energy, XLE and Utilities, XLU. Take special notice to the fact that the Utilities sector, which has been the strongest as recently as two weeks ago is now one of the weakest.

Financials Select Sector SPDR, XLF
Energy Select Sector SPDR, XLE
Utilities Select Sector SPDR, XLU
All three had there high point on Monday (XLE briefly higher in Tuesday) and fell through the week. It is possible that the price action could be a bull flag for XLF and XLE but, all three printed bearish engulfing candles on Friday, suggesting more downside. Also, all have decidedly downward trending RSI and MACD indicators. The first two, XLF and XLE, had shown good runs higher previously, ending near the 200 day SMA and are now tracking the falling 100 day SMA lower. These two have been bouncing in a range for 4 months and the recent top was near the top of that range. XLU has the worst looking momentum indicators with MACD that crossed lower this week and RSI that has been falling for over a week. Putting a little confusion into the mix, all three sectors have rising short term SMA's, which could give them a lift.

As you look through theses charts note that their positioning is deliberate and intentional. They exhibit a progression from a strong uptrend to a flattening and then a potential downward reversal. Some of the sectors that have been leaders are stalling and pulling back. This is not a prediction that the rally that has taken the market to test its recent highs is over. One week's action does not create a trend or a change. I do however think that there is a message in the rotation. Having Technology and not Utilities lead the way is a good omen for future market strength if it holds up. But it also shows that there are sectors like Financials that need to participate for a full blown rally, which are not currently, and Consumer Staples that you would not expect to lead a broad based rally, but are. Until this shift occurs we may be in for more of the same stumbling along for a while.

Trade'm well.

Friday, September 17, 2010

From the Charts: Macro Week in Review/Preview September 17, 2010

The week began looking like Gold and the US Dollar Index might take a breather. US Treasury Bonds were on support but looked weak and headed lower. Although Oil was strong it was nearing layers of resistance which could take some time to work through. Volatility seemed to have found a bottom, although still weak, which would allow stocks to continue their move higher, towards a test of the top of the four month (or maybe one year) channel. I detailed this in the broad market trend reviewed Friday September 10th. The week started with a bang as the equity index ETF's went right to resistance on Monday and stayed there all week, except for the QQQQ which did not stop and is trying to drag the others higher. Gold and the US Dollar Index did rest for a couple of days before Gold started higher but the dollar broke lower and Treasuries started to lose their range lower. Oil did test the top of resistance and was smacked back hard. How does this set up for next week? Let's look at the details in the charts.

Gold Daily

Gold Weekly
Gold took Monday off then rocketed up to new highs on Tuesday, rested again Wednesday and created higher highs ending the week. With this move it now has support at 1270 and then 1255 and 1247.79 below. The weekly chart shows a continued move within the long upward trending channel through the 1255 area and onward now to the target of 1328. The Relative Strength Index (RSI) is indicating that it is getting a little overbought so it might rest again, but the trend and momentum is still higher. It wants more. This is re-enforced by the rising Simple Moving Averages (SMA's) and the positive Moving Average Convergence Divergence (MACD) on both the daily and weekly charts, with special notice to the MACD cross on the weekly chart.

West Texas Intermediate Crude Daily

West Texas Intermediate Crude Weekly
West Texas Intermediate Crude does not seem to want to join the party. Despite entering the week with positive technicals it tested the 200 day SMA and then rejected lower, as noted above, through the 50 ad 100 SMA's. With a bearish engulfing candle Friday it is hanging on support of 74.70, the 20 day SMA , by a thread with support lower at 72, and it looks weak. Should it bounce there is resistance at 75 and then the 76.22-.72 area followed by 77.76. A lot to work through to get back where it was on Monday. The MACD and RSI have also turned lower suggesting its upward run may be ending. Switching to the weekly chart, the consolidation continues below the SMA's with the 20 week SMA adding a negative bias as it crosses lower. Below the flag there is support at 71.19 and then 70. Should it break the SMA's higher there is resistance at 81.50.

US Dollar Index Daily

US Dollar Index Weekly
Speaking of weak, the US Dollar Index is the poster child. It fell right out of the blocks Monday and took another beating Tuesday. Since then is has created a bear flag with support at 81 and then 80.70 followed by 80. The weekly chart shows that it lost support at 82.08 and 81.63, the 100 week SMA. Both will now act as resistance. The MACD and RSI on the weekly chart appear very bearish. Should it miraculously rise from the dead, there is resistance at 81.72-82 and then 82.28-.44.

iShares Barclays 20+ Yr Treasury Bond Fund Daily

iShares Barclays 20+ Yr Treasury Bond Fund Weekly
My proxy for US Treasuries, the TLT, lost support of the 50 day SMA at 101.98 on Thursday and could not reclaim it. The bearish action within the positive candle Friday is also a sign of weakness. There is resistance higher near 103 from the upward trendline and 104.80 higher. the increasingly negative MACD and falling RSI suggest it is heading lower. Continued weakness sees support at 100 followed by 98.92. The weekly chart paints a similar picture with no new knowledge of support or resistance but a couple of key indicators to watch for. Fist this week's candle was a star signifying indecision so be nimble enough to react to a possible reversal. The MACD however is crossing lower and a falling RSI bode for more downside.

VIX Daily

VIX Weekly
There is not much to say about the Volatility Index. It has been in a range on both the daily and weekly charts for several weeks now between 21.25 - 28.4. the SMA's on both charts provide some resistance if the VIX were to move higher. Under the range the daily chart shows support at 18 and the weekly at 16.93.

SPY 60 minute

SPY Daily

SPY Weekly
The 60 minute chart shows clearly that the SPY is testing the 113.20 area for the third time in four months. RSI is falling but still near 50 and the MACD looks stable on this chart. It could go either way. There is support lower at 112.13-22 and then 111.68, and resistance above at 114.67 from May. Switching to the daily chart this week was a 5 day island gap up and is sitting against resistance at 113.25. Should it break through the next resistance is at 114.55. The MACD indicator is decreasing and the RSI is rolling over indicating that there may be a move lower. If so, support can be found at 112 followed by 111.28 and 110. The weekly chart printed a Doji star, signaling indecision, at the 113.26 resistance area. There is further resistance above at 114.67 and 115.38, and further support below at 110.26 then 109.20. There does not appear to be real power in either direction.

IWM Daily

IWM Weekly
The daily chart for the IWM shows a 5 day consolidation range between 64.50 and 65.50. It is slightly bearish as the real bodies became smaller Thursday and Friday and the shadows longer. But it did hold above the bearish 100 day 200 day SMA cross.The MACD is positive but starting to decrease and the RSI is flat lined. If it gets through 65.50 then resistance can be found at 66.50 and 67.25 higher. Support comes first at 64.52 and then 63.29. On the weekly chart IWM is up against resistance from the downtrend line 65.21. Resistance on a breakthrough comes at 70 higher. The tight SMA's act as support below as well as 58.68. The weekly shows the MACD crossing higher and the RSI rising giving it a slight bullish bias. Taking both the daily and weekly charts into account there is not a clear bias in either direction here either.

QQQQ Daily

QQQQ Weekly
The QQQQ is the anomaly in the Index ETF space. It had a strong gap up move Monday and kept going. Have broken and held the long term support/resistance level near 47.80 it is now ready to test the 48.50 May highs with resistance above that at 50.10. The RSI is only approaching being overbought near 70 and the MACD is positive but may be waning. The one bearish glimpse is the solid black candle indicating a bearish day Friday with in the up move, starting at the high and closing lower, also creating a bearish Hanging Man. If it falls then support can be found at 47 and 45.75-.90 lower. The weekly chart shows it at resistance of 48 from September 2008 with 50.55 as resistance beyond that. The converging 20 and 50 week SMA's provide support lower and then 43.80 before the 200 week SMA at 42.51. If you had to pick one broad equity index ETF that is heading higher this would be the one. The weekly also shows an increasing MACD and rising RSI. At least one index knows where it wants to go.

So next week looks to bring more new highs for Gold. US Treasury Bonds and the US Dollar Index appear to be heading lower. Oil looks will probably join them going lower as well. The volatility index does not seem like it will impede stocks but only the QQQQ's seem to know that they want higher with the SPY and IWM still scratching their heads about the next move. Good luck next week and trade well!