Gold Daily

Gold Weekly

Gold finally showed its hand on Thursday with a strong move above the 50 day SMA and held the breakout on Friday. On the weekly chart it has support of the rising 20 week SMA. The 50 day SMA is now support and gold is ready to run for 1220 and then 1233-45. The weekly chart shows additional resistance at 1225 on the way and finally at 1264. Support below the 50 day SMA is at 1200 and then 1189 with the weekly chart adding 1175.
West Texas Intermediate Crude Daily

West Texas Intermediate Crude Weekly

Oil broke lower through the 20, 100 and 200 day SMA's on Wednesday continuing lower Thursday below the 50 day SMA and challenging the bottom of recent 76 - 82 channel near 75.75ish. It is still probing lower and looks to test support at 74.80 soon. The bearish engulfing candle on the weekly chart reinforces this having blown through all the weekly SMA's, and shows support lower at 72 and then 68.07. Resistance comes at all those SMA's on the weekly chart and at 77 followed by 78.19-79.08 from the daily chart.
US Dollar Index Daily

US Dollar Index Weekly

The US Dollar Index retook the 200 day SMA on Tuesday and then never looked back. It looks to continue it's strong move up with resistance at 83.66-.96 on the daily chart, near where the 50 day and 100 day SMA's are converging. The weekly chart shows the strong bounce off of the 50/200 week SMA cross at 80.13, which is now support, and forecasts resistance at 83.67 followed by 86. Support can be found at 82.50 then 81.82-82.
iShares Barclays 20+ Yr Treasury Bond Fund Daily

iShares Barclays 20+ Yr Treasury Bond Fund Weekly

The long Term Treasury ETF finally cracked the top of 98.25 - 102 channel on Friday. If it can hold that level it can run to 104, and then perhaps 108 as pointed out on the weekly chart. Failure to hold the 102 level will see support in the 99.83-100.20 area and then 98.25 below. RSI and MACD are positive reinforcements to the case higher.
VIX Daily

VIX Weekly

The daily VIX chart popped on Wednesday above the 100 day SMA and held. It has started a flag since, resting for the next move. Looking at the weekly chart the downtrend line from early June was breached to the upside and stopped just above the 200 week SMA. It looks poised to go higher, especially if it can break 26.65, the 50 day SMA, from the daily chart, and then would see resistance at 28 and then 30 above, with the weekly chart adding 32.75 as further resistance. if the breakout fails, support can be found at 25.38 then 24 and 23.44-23.50.
SPY 60 minute

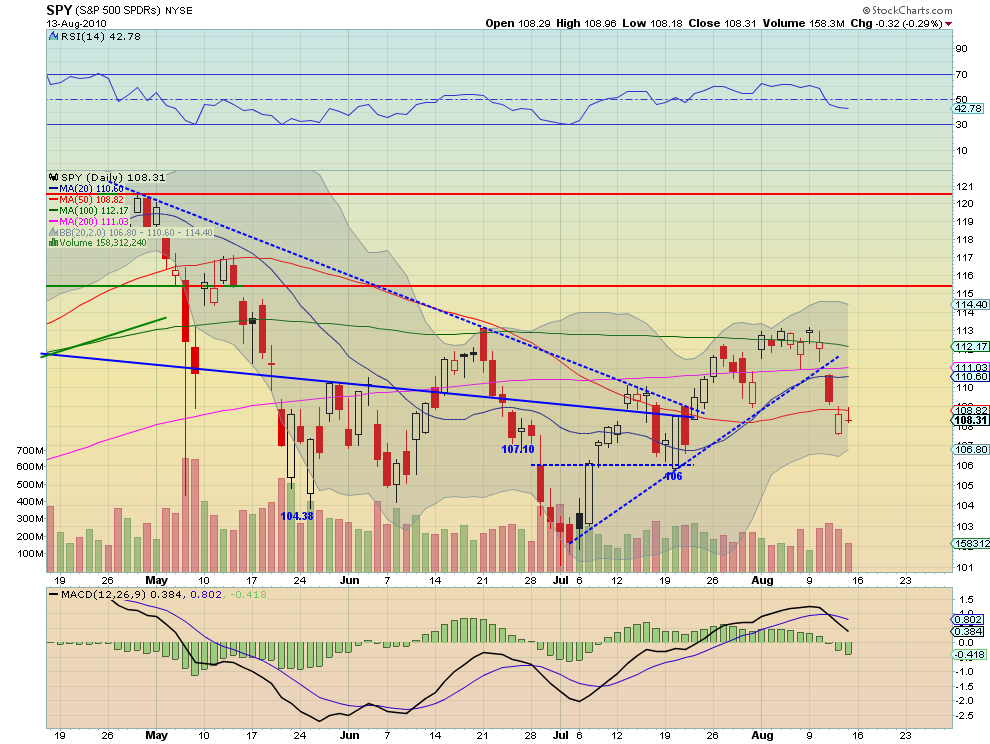
SPY Daily
SPY Weekly

The SPY 60 minute chart shows a couple of unfilled gap downs this week and tight trading range on Friday. There are many potential support and resistance points but it clears out a bit once the SPY gets below 106. Switching to the daily chart shows the strong move down Wednesday followed by lower moves at the end of the week and a doji today. The weekly chart tells a strong story with a long red candle with very short shadows. This is heading lower. Support can be found at 107.10 then 106 and 104.38-.75. Resistance is clearly at the 50 day SMA which it could not retake, at 108.82, and then 110 above that. The weekly chart adds resistance as well at the 50 week SMA at 109.51.
IWM Daily

IWM Weekly

The daily chart shows IWM losing the 20, 50, and 200 day SMA's all on Wednesday, and then following lower the rest of the week. Today's inside day bodes for a continuation lower and this is reinforced when looking at the weekly chart. Support may be found at 61 or lower at 60.25 from the daily chart and the weekly adds support lower at 58.47 then 56. Resistance comes first at 61.75ish followed by 63 and then all the daliy and weekly SMA's.
QQQQ Daily

QQQQ Weekly

The Q's flew through the 20, 50, 100 and 200 day SMA's on Wednesday and then dropped lower to end the week. Friday's inside day bodes for a continuation lower, with support at 44.50 then 44 and 43.50. This is reinforced by the weekly chart which also lost the 50 week SMA and now sees support at 42.78 below the previously mentioned levels. Resistance could come at the tightly grouped 20, 50 and 200 day SMA's as well as 45.75 and 45.90. Lots of resistance in a tight range.
So next week looks to bring stronger prices for Gold and the US Dollar Index with US Treasury Bonds trying to join the party. Oil looks broken and on a path lower. And a rising volatility index combined with that stronger dollar should continue to press stocks lower. Good luck next week!


No comments:
Post a Comment