
There are 2 sets of Fibonacci lines. The purple ones are from the July 2008 highs to the November/December 2008 lows. The blue ones are from that Nov/Dec 08 low to the January 2010 highs. Note first that this high was a 50% retracement of the purple range, so the blue lines create a further granularity underneath the purple lines. What to make of this? the 20 and 50SMA cross throughs are bearish signals. Many traders would go short based just on them happening. And you can see the initial 20/100 and 200SMA crosses did send stock price lower. Now the 50 crossing the 200 is signaling another leg down. But the 20SMA is sitting right there as support as well as the Fibonacci level. From the perspective of the Fibonacci levels BTU has regained 38.28 Fib level and looking to head to the gathering of of moving averages.
Here is a shorter timeframe to expand the recent action

Here you can see the added feature that there was a breakout of a small symetrical triangle adding fuel to the long case.
So what to make of this? Total confusion? - maybe. But I think that it is a reflection of the action in the broader market. Volatility is elevated creating broader ranges. Stocks are at or near critical support and resistance levels, so snapping through one has traders piling in or out. My conclusion: Outside of saying we are in a range, there is general uncertainty in this market. Adding the elevated level of volatility it is a market for brokers collecting commissions, and very nimble traders, day traders and some swing traders, not investors or, position traders. Those with more than a 5 hour horizon should be watching to see when this rollercoaster stops.
Trade for tomorrow:
Long Forrest Oil Corp, FST,
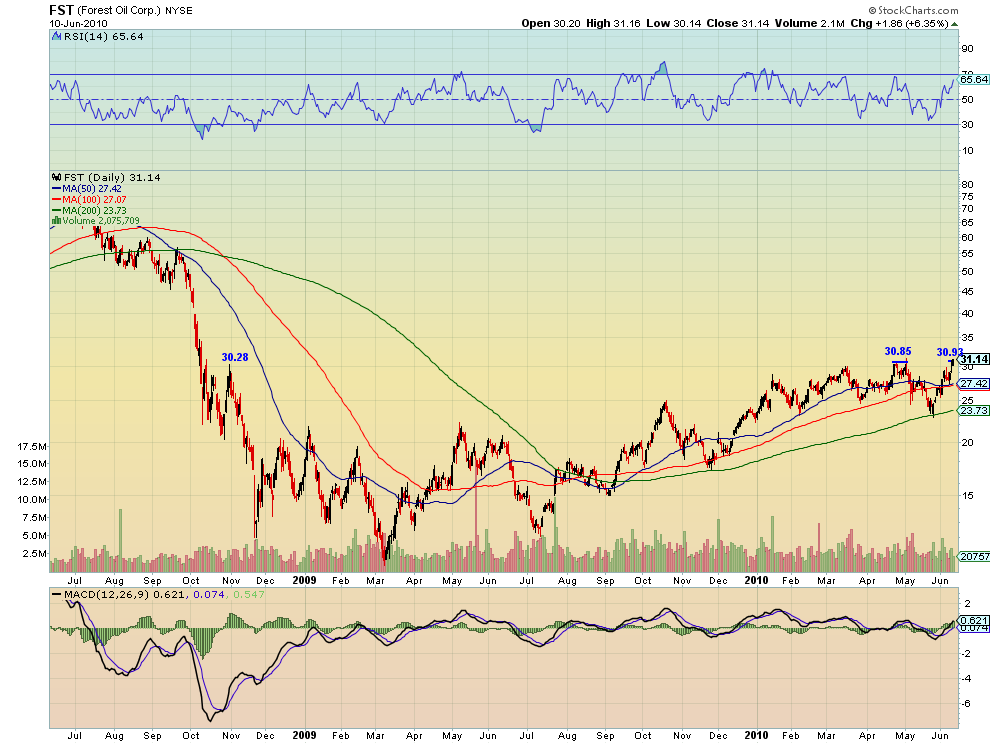
Clear air to 45 from here. support at 30.25 - 30.80, Thanks to @mikewill17 (twitter id) for asking about it.
Trad'em well.


Isn't the 50 day SMA crossing through the 200 day SMA called the "death cross"? If you are seeing this in many charts, isn't that extremely bearish? I agree that most investors will get killed by this whipsaw action. Better to be watching from the sidelines unless you are a day-trader.
ReplyDelete